Waiting for the Structural Completion
While most investors are desperately searching for signs of a rebound as Solana hovers around the $80 mark, my analysis suggests a different path. Based on the weekly Elliott Wave structure, we are currently in the final stages of a C-wave correction. In this post, I will explain why the $67 low is the ultimate benchmark for the next major entry and how the broader altcoin market is preparing for a massive shift.
1. The Weekly Chart: Decoding the A-B-C Zigzag Structure
The current correction in Solana is a textbook example of a 5-3-5 Zigzag pattern. In Elliott Wave theory, price doesn’t just move randomly; it follows a sequence. As I emphasized in my recent Seoul Economic TV “Coin One Shot” broadcast, Wave A and Wave B are already complete. We are now navigating the internal sub-waves of Wave C.
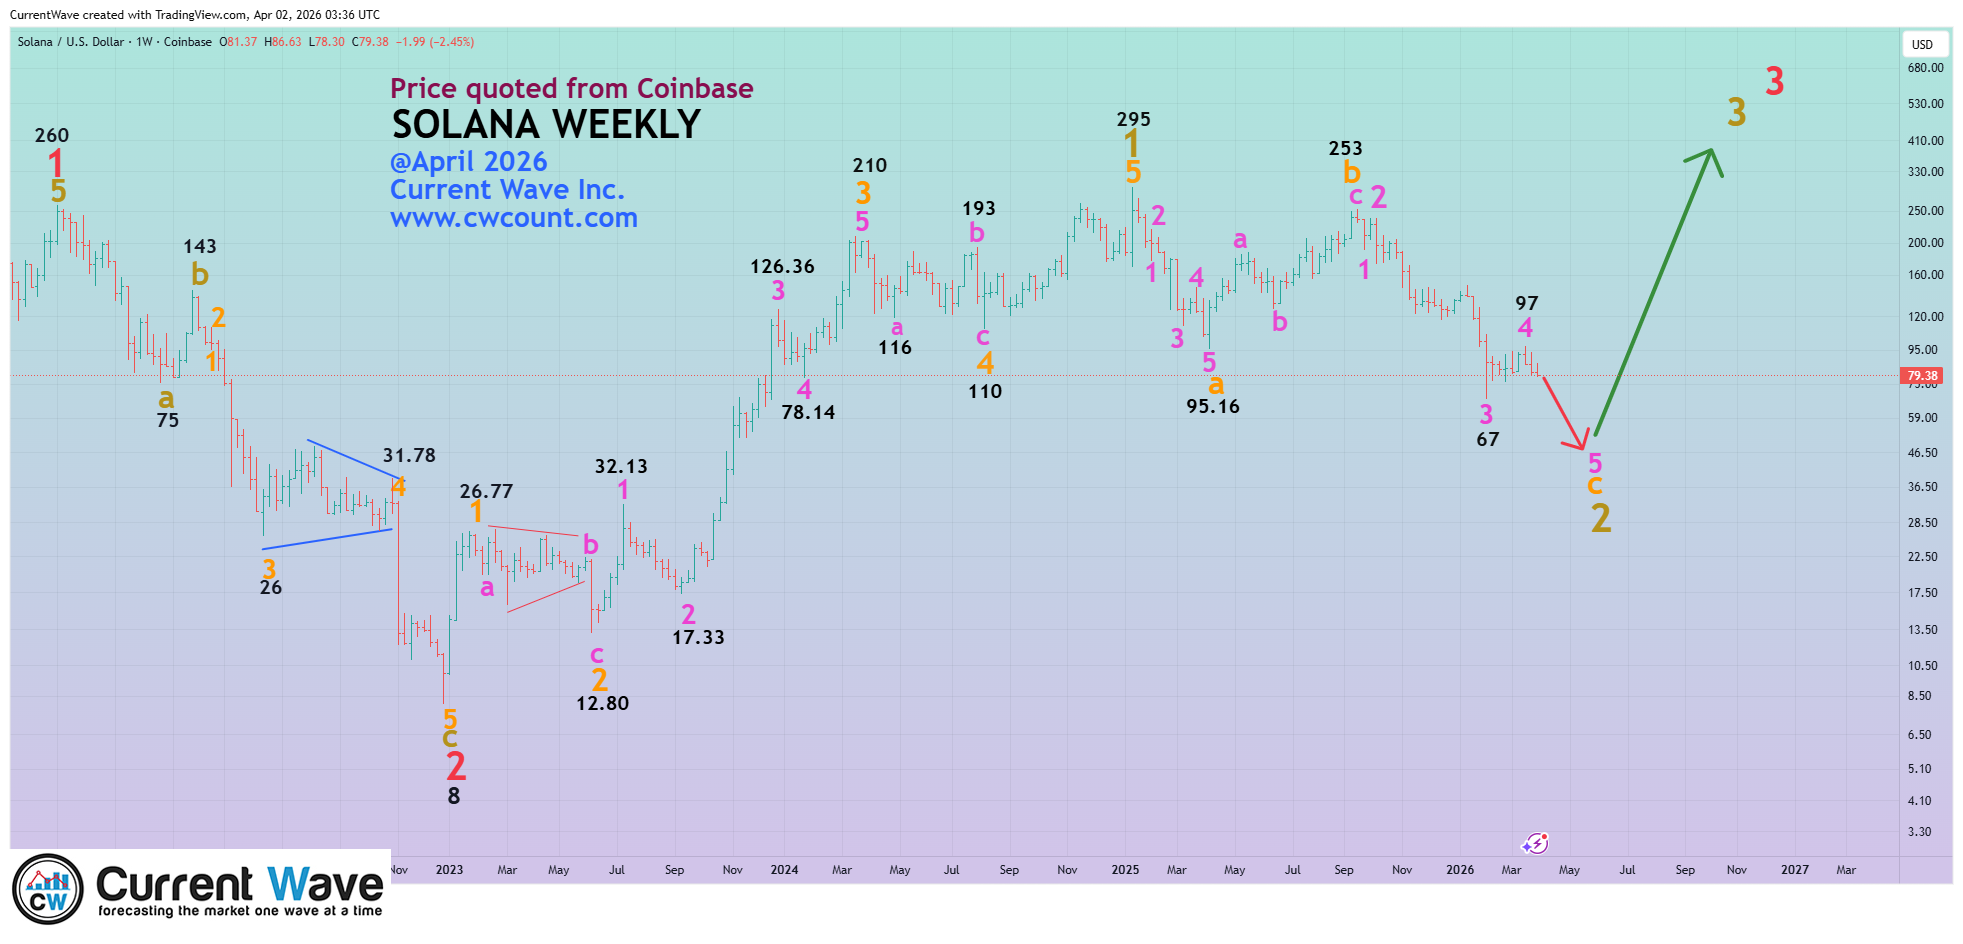
The critical takeaway is that Wave C must consist of five sub-waves to be structurally “finished.” Currently, we have seen four of those sub-waves, meaning the final 5th wave—the ultimate capitulation—is still pending. Until this structure is complete, any minor bounce is merely a “dead cat bounce” within a larger corrective frame.
2. The $67 Threshold: The Logical Entry Point
Why am I fixated on $67? This level represents the low recorded in February 2026, when Bitcoin was nearing the $60,000 mark. For the 5th sub-wave of the C-wave to be valid, it typically needs to break below the previous low of the 3rd sub-wave.
“The picture only becomes clear once that $67 level is broken.” This isn’t just about a price drop; it’s about structural fulfillment. Waiting for this breakdown allows us to avoid the “fake-out” rallies that trap retail investors at $80. At cwcount.com, we prioritize these high-probability structural completions over emotional bottom-fishing.
3. Altcoin Market Signals: Golden Cross and Bullish Divergence
While we wait for Solana’s specific completion, the broader altcoin market (excluding Bitcoin) is flashing significant long-term signals. We have observed a Golden Cross where the 100 EMA has crossed above the 200 EMA on the daily charts.
Furthermore, a multi-month Bullish Divergence is forming on the MACD. While prices have been grinding lower or sideways, the momentum oscillator is trending upward. This suggests that while the “price” is under pressure, the “selling exhaustion” is nearing its peak. However, remember my golden rule: market-wide signals provide the context, but the individual wave structure (the $67 break for SOL) provides the timing.
4. Fundamentals: The Institutional Backbone of Solana
Why choose Solana for the next cycle? Beyond the charts, Solana has solidified its position as the premier infrastructure for institutional payments. With recent expansions in Visa’s USDC settlement pilot and the seamless integration of Solana Pay with Shopify via Helio, the network’s real-world utility is unmatched.
Institutions are not looking at short-term volatility; they are looking at throughput and cost-efficiency. Solana provides both. This fundamental strength ensures that once the C-wave correction is finalized, the recovery will be backed by genuine demand, not just speculative hype.
Patience is the hardest but most rewarding strategy in crypto. Most traders will lose capital by entering early at $80. By waiting for the $67 signal, we align ourselves with the natural flow of the market structure. The upward cycle is far from over—it’s just preparing for its next launchpad.
Sources & References
Visa Launches Stablecoin Settlement in the U.S. via Solana (Visa Investor Relations, 2025.12)
Case Study: Shopify x Solana Pay Integration via Helio (Solana Foundation News, 2024.01)
Crypto Bull Run Outlook 2026: Technical Signals (CoinDCX Blog, 2026.04)