History
During the 1930s an accountant named Ralph Nelson Elliott started to analyze all existing stock market data from its inception. He looked at price movements in the financial markets and keenly saw that pattern in the markets have repetitive qualities. The way in which he proved his discovery was by making countless accurate stock market forecasts. On the surface it appears random and isolated but Elliott came to the conclusion it is actually mapping out a recognizable pattern with repetitive tendencies. He rigorously back tested his hypothesis and after seeing its effectiveness, Elliott ultimately named his theory “The Wave Principle”. Elliott realized that the movements in the stock market can actually be predicted by looking at and identifying the repetitive nature of waves. His next conclusion was that any crowd or social based behavior can be modeled and predicted with precision like accuracy.
Elliott Wave Theory
Most of the technical analysis is derived upon these cycles of mass human behavior that is factored in the movements of price. Elliott Wave theory is a totally different concept of analysis in that it is possible to understand and pinpoint exactly where prices are within that cycle at any given point in time. By comprehending where prices are in the Elliott Wave cycle, investors can create an edge or an advantage in their effort to measure risk to reward by locating ideal entry and exit points for their investments.
Basic Tenets of Elliott wave
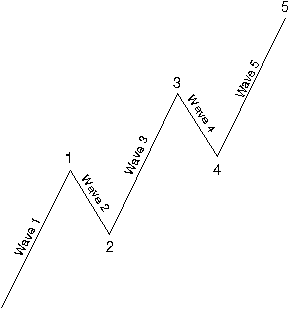
Impulsive waves are composed of five subwaves (labeled as 1, 2, 3, 4, 5) and move in the same direction as the trend of the next larger size. Impulse waves powerfully propel the market to the upside in a bull market and powerfully propel the market to the downside in a bear market. Within the 5 wave impulse move, waves 1,3 and 5 move in the direction of primary trend, and waves 2 and 4 will be counter trends in the opposite direction. Thus, the waves 1,3 and 5 are actionary waves and waves 2 and 4 are reactionary waves.
A corrective wave follows, composed of three subwaves (labeled as a, b, c), and it moves against the trend of the next larger size. Corrective wave retraces progress achieved by any preceding impulse wave.
Thus, one complete Elliott wave consists of eight waves and two phases: five-wave impulse phase, whose subwaves are denoted by numbers, and the three-wave corrective phase, whose subwaves are denoted by letters.
Naturally, the Impulse waves will gain or lose a lot of ground whereas in corrective waves, prices tend to struggle to go anywhere. Corrective waves are more of a sideways consolidation or range bound move that occurs when the market wants to maintain the price levels that have been gained or lost.

The Complete Wave Template
If you look at the macro level trends or at the micro level trends (above), the individual components of a set of waves, you see the same basic pattern repeating again and again, so you can say that market structure is fractal in its character. The micro level waves are simply more granular and detailed models exhibiting all the characteristics of the macro level waves.

The Cycle Degree
The cycle degree has different names to identify the position of the wave within the overall progress of the market. Based on the amplitude, the above illustration indicates the types of wave cycles from largest to smallest. These describe the degree of change in a larger cycle, or the amplitude. The cycle waves are subdivided into primary waves, that are in turn subdivided into intermediate waves which are in turn subdivided into minor and sub minor waves, with the smaller wave patterns having the same fractal characteristics.

Motive Waves
Motive wave is a 5 wave move in the same direction as the trend of one larger degree. There are three types of motive waves: impulsive wave, extension and diagonal.
Impulsive waves subdivide into 5 waves and the impulsive move further subdivides into another 5 waves in minor degree. Within these waves, the wave 2 never retraces more than 100% of wave 1 and wave 4 never retraces more than 100% of wave 3. Wave 3 always travels beyond end of wave 1.Wave 3 is is often the longest and never the shortest among the 3 actionary waves 1,3 and 5. Wave 4 does not overlap with the price territory of wave 1.
Extension is an unusually long impulsive wave with exaggerated sub-waves. That is, only one of the waves from 1,3 and 5 will be extended. Extension typically occurs during wave 3 and the sub-waves within an extension have nearly the same duration and amplitude as the ones in the rest of the wave. If extension occurs on wave 5, then waves 1 and 3 will be normal waves with no extensions. Rarely extension occurs at wave 1, if so, wave 3 and 5 will be normal waves with no extensions.
Diagonal is the second type of motive wave, its purpose is to move the market in the direction of the trend and it consists of five sub-waves but the difference is that diagonal typically exhibits a wedge shape with an expanding or contracting characteristics. The sub-waves of the diagonal may not have a count of five, depending on the type of diagonal being analyzed.

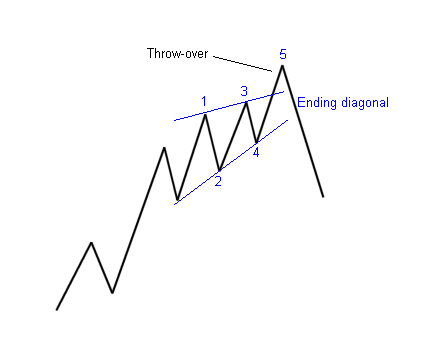
Ending Diagonal is a wave that occurs in wave 5 of an impulse or the last wave of a corrective pattern typically on wave C of an ABC correction. This wave often occurs when the pending move of the trend has gone too far, too fast and has been exhausted. Most of the time, they are found at the end of the higher degree motive or corrective waves. This wave pattern indicated the termination of the previous trend of one higher degree. The ending diagonal has a structure count of 33333. All five of the waves of an ending diagonal break down to only three waves each, indicating exhaustion of the larger degree trend. Also, wave 2 and wave 4 may overlap each other.
Leading Diagonal is rare, and are found in wave 1 of an impulse wave or wave A of a zigzag correction, They have 53535 wave structure like an impulse wave, but in this case, wave 2 and wave 4 overlap, and they form a wedge pattern with converging boundary lines. Because of the five subdivisions of wave 1,3 and 5, this pattern indicates continuation of the trend where the ending diagonal pattern of 33333 indicates termination of the trend.

Corrective Waves
The correction comes from in the form of a move in the opposite direction to the impulse move, a counter trend that is made up of 3 waves, the corrective waves are numbered using alphabets. Compared to the impulse moves the corrective waves are difficult to identify and interpret. These ABC corrective moves have been classified into 21 different kinds of patterns, out of of these patterns the three most basic patterns are Zigzag, Flat and Triangle.
Zigzag corrective waves bring a substantial correction in the on-going trend. A single zigzag is a three wave corrective structure that is labeled as ABC. The sub-wave sequence is 535, the wave A and wave C are motive waves with five sub-waves, while B wave is corrective with three sub-waves. The zigzag is known to form a sharp style of correction, and in an impulse wave, typically occurs at the second wave. Zigzag may also form in combination which is called a double zigzag or even a triple zigzag, where two or three zigzags form connected by another corrective wave between them.
Flat correction is another three wave correction where the sub waves form a 335 structure. In this case, both waves A and B are of the corrective variety and Wave C is motive with five sub-waves. It is called a flat because the pattern moves in a sideways direction. Flat typically appears on 4th wave within an impulse wave and rarely occurs on 2nd wave. However, there are variations of flat correction, a flat correction that has the B wave terminate beyond the start of the wave A and the C wave terminate beyond the start of the B wave is called an expanded flat. The other flat is called a running flat, which often occurs in strong trends of one higher degree, running flat has wave B terminating beyond the beginning of wave A, but wave C will fall well short of beginning of wave A.
Triangle is a sideways movement that is associated with decreasing volume and volatility. Triangles have 5 sides and each side is subdivided in 3 waves hence forming 3-3-3-3-3 structure. There are 4 types of triangles in Elliott Wave Theory: ascending, descending, contracting, and expanding. Corrective structures are labelled as ABCDE and they usually occur in wave B of corrective waves or wave 4 of motive waves. Triangle waves are subdivided into three (3-3-3-3-3) and the subdivision of ABCDE can be either abc, wxy, or flat.
Double three is a sideways combination of two corrective patterns. Included in double three are these corrective patterns mentioned above: zigzag, flat, and triangle. When two of these corrective patterns are combined together, we get a double three. A combination of two corrective structures are labelled as WXY where wave W and wave Y subdivision can be either a zigzag, flat, double three of smaller degree, or triple three of smaller degree. Wave X can be any corrective structure and WXY is a 7 swing structure.
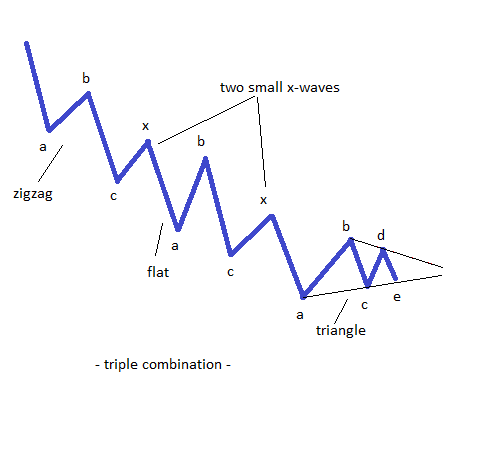
Triple three is a sideways combination of three corrective patterns. The combination of three corrective structures are labelled as WXYXZ where wave W, wave Y, and wave Z subdivision can be a zigzag, flat, double three of smaller degree, or triple three of smaller degree. Wave X can be any corrective structure and WXYZ is an 11 swing structure.

Fibonacci Series Characteristics
The Fibonacci number sequence is made by simply starting at 1 and adding the previous number to arrive at the new number: 0+1=1, 1+1=2, 2+1=3, 3+2=5, 5+3=8, 8+5=13, 13+8=21, 21+13=34, 34+21=55, 55+34=89, etc. The ratio of any number to the next number in the series approaches 0.618 or 61.8% (the golden ratio) after the first 4 numbers. For example: 34/55 = 0.618. The ratio of any number to the number that is found two places to the right approaches 0.382 or 38.2%. For example: 34/89 = 0.382. The ratio of any number to the number that is found three places to the right approaches 0.236 or 23.6%. For example: 21/89 = 0.236.These relationships between every number in the series are the foundation of the common ratios used to determine price retracements and price extensions during a trend.
Fibonacci Analysis
Fibonacci numbers provide the mathematical foundation for the Elliott Wave Theory. While the Fibonacci ratios have been adapted to various technical indicators, their utmost use in technical analysis remains the measurement of correction waves.

Fibonacci Price Retracements
A retracement is a move in price that “retraces” a portion of the previous move. Usually a stock will retrace at one of 3 common Fibonacci levels – 38.2%, 50%, and 61.8%. Fibonacci price retracements are determined from a prior low-to high swing to identify possible support levels as the market pulls back from a high. Retracements are also run from a prior high-to-low swing using the same ratios, looking for possible resistance levels as the market bounces from a low.
Fibonacci Price Extensions
Fibonacci price extensions are used by traders to determine areas where they will wish to take profits in the next leg of an up-or downtrend. Percentage extension levels are plotted as horizontal lines above/below the previous trend move. The most popular extension levels are 61.8%, 100.0%, 138.2% and 161.8%.
Guidelines
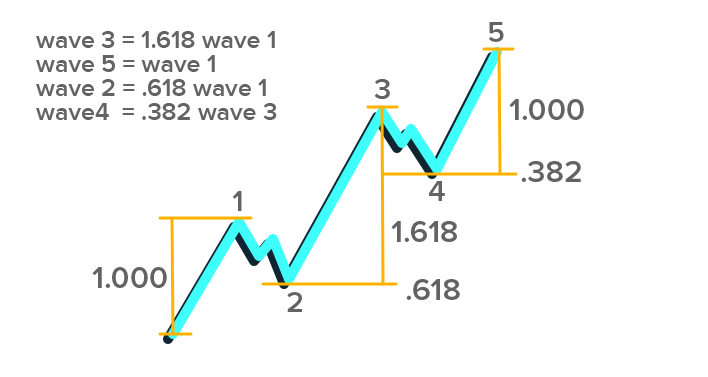
In contrast to rules, there are key guidelines which should hold true most of the time, not necessarily all of the time. When wave 3 is the longest impulse wave, wave 5 will approximately equal Wave 1.This guideline is useful for targeting the end of wave 5. Even though wave 5 could be longer than wave 3 and wave 3 could still be longer than wave 1, chartists can make initial wave 5 projections once wave 4 ends. In a larger uptrend, chartists simply apply the length of wave 1 (percentage change) to the low of wave 4 for an upside target. The opposite is true for a 5-wave decline. The percentage decline in wave 1 would be applied to the high of wave 4 for a wave 5 estimate. The forms for wave 2 and wave 4 will alternate. The guideline of alternation (2) is useful for determining the time of correction for wave 4. After a sharp decline for wave 2, chartists can expect a relatively flat correction for wave 4. If wave 2 is relatively flat, then chartists can expect a relatively sharp wave 4. In practice, wave 2 tends to be a rather sharp wave that retraces a large portion of wave 1. Wave 4 comes after an extended wave 3. This wave 4 marks more of a consolidation that lays the groundwork for a wave 5 trend resumption. If wave 2 is a sharp correction, wave 4 will be a flat correction. If wave 2 is a flat correction then wave 4 will be a sharp correction. After a 5-wave impulse advance, corrections (abc) usually end in the area of prior wave 4 low. The third guideline is useful for estimating the end of a wave 2 correction after a wave 1 advance. Waves 1 and 2 are the larger degree waves. Waves 1-2-3-4-5 are lesser degree waves within wave 1. Once the wave 2 correction unfolds, chartists can estimate its end by looking at the end of the prior wave 4 (lesser degree wave 4). In a larger degree uptrend, wave 2 would be expected to bottom near the low of lesser degree wave 4. In a larger degree downtrend, wave 2 would be expected to peak near the high of lesser degree wave 4.