Welcome to the CWCOUNT Education Center.
This hub explains how Elliott Wave Theory
is applied to Bitcoin market analysis using the CWCOUNT OBLX standard.
It focuses on structure-first wave counting for Bitcoin,
covering motive waves, corrective structures,
and Fibonacci guidelines used to interpret
current Bitcoin price movements and forecasts.
What this page explains
- How Elliott Wave Theory is applied to Bitcoin market structure
- Why CWCOUNT uses a rule-based, structure-first wave counting approach
- How motive waves, corrective structures, and Fibonacci guidelines work together
- How to read Bitcoin price action using nested wave depth (CWCOUNT color system)
Elliott Wave Theory: The Complete Market Structure Framework
This page serves as the central reference hub
for understanding Elliott Wave concepts
as they are applied to Bitcoin analysis within CWCOUNT.
Elliott Wave Theory is a rule-based market structure framework that interprets price movements as repeating wave patterns driven by collective investor psychology.
In the CWCOUNT OBLX standard, Elliott Wave analysis focuses on:
– Motive waves to identify directional market phases,
– Corrective waves to classify consolidation and retracement structures,
– Fibonacci ratios as secondary tools to contextualize price behavior within a valid structure.
Core Elliott Wave Structure
- Motive Waves – Directional market phases (impulses, extensions, diagonals)
- Corrective Waves – Consolidations, retracements, and complex corrective structures
- Fibonacci Guidelines – Measurement tools used within valid wave structures
Foundational Reference: Elliott Wave Theory
1. HISTORY & ORIGIN OF ELLIOTT WAVES
1.1 In the 1930s, accountant Ralph Nelson Elliott began analyzing all available stock market data from its inception.
1.2 He discovered that price movements—long believed to be random—actually displayed repetitive, recognizable patterns.
1.3 Elliott validated this discovery by producing numerous accurate stock market forecasts.
1.4 What looked like isolated chaos was revealed to be part of a larger repeating structure.
1.5 After extensive back-testing, he named his discovery “The Wave Principle.”
1.6 Elliott proposed that any crowd-driven or social behavior could be modeled and forecasted with surprising precision.
1.7 Elliott Wave Theory differs from traditional indicators by identifying where price currently sits in the overall psychological cycle, giving investors a strategic edge in timing and risk–reward.
2. CORE STRUCTURE OF ELLIOTT WAVES
2.1 Impulse Waves (5-wave pattern)
2.1.1 Impulse waves contain five subwaves: 1, 2, 3, 4, 5.
2.1.2 They move in the same direction as the larger trend.
2.1.3 Actionary waves: 1, 3, 5.
2.1.4 Reactionary waves: 2, 4.
2.1.5 Impulse waves gain significant ground in the direction of trend.
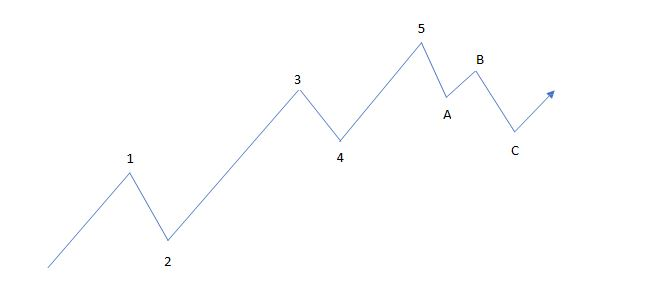
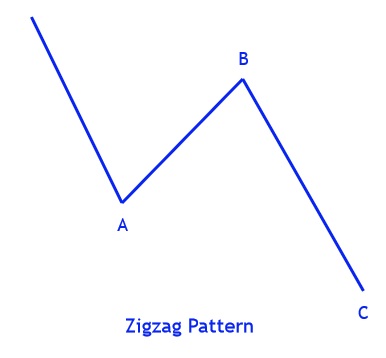
2.2 Corrective Waves (3-wave pattern)
2.2.1 Corrections follow impulses and contain three subwaves: A, B, C.
2.2.2 They move against the larger trend.
2.2.3 They retrace the progress made by the preceding impulse.
2.2.4 They are often sideways, choppy, and slower than impulses.
2.3 Complete 8-Wave Cycle
2.3.1 A full Elliott cycle = 5-wave impulse + 3-wave correction.
2.3.2 Corrections typically struggle to make progress; impulses typically travel strongly.
2.4 Fractal Template
2.4.1 Waves are fractal: micro-level waves mirror macro-level waves.
2.4.2 All wave structures, large or small, repeat the same internal behavior.
2.5 Degrees of Trend
2.5.1 Elliott defined various degrees (Grand → Primary → Intermediate → Minor → …).
2.5.2 Larger waves subdivide into smaller-degree waves with consistent fractal characteristics.
3. MOTIVE WAVES (IMPULSES, EXTENSIONS, DIAGONALS)
3.1 Definition
3.1.1 A motive wave is any 5-wave move in the direction of the larger-degree trend.
3.1.2 Three types: Impulse, Extension, Diagonal.
3.2 Impulse Waves (Standard)
3.2.1 Subdivide into five clear subwaves.
3.2.2 Subwaves can subdivide again into smaller 5-wave structures.
Rules that must always hold:
3.2.3 Wave 2 never retraces more than 100% of Wave 1.
3.2.4 Wave 4 never retraces more than 100% of Wave 3.
3.2.5 Wave 3 always travels beyond the end of Wave 1.
3.2.6 Wave 3 is never the shortest among 1, 3, and 5.
3.2.7 Wave 4 must not overlap Wave 1 territory.
3.3 Extensions
3.3.1 An extension is an unusually long impulse wave.
3.3.2 Only one of Waves 1, 3, or 5 generally extends.
3.3.3 Most common: Wave 3 extension.
3.3.4 Subwaves inside extensions often have matching duration/amplitude.
3.3.5 If Wave 5 extends → Waves 1 & 3 remain normal.
3.3.6 Rare Wave 1 extension → Waves 3 & 5 are normal.
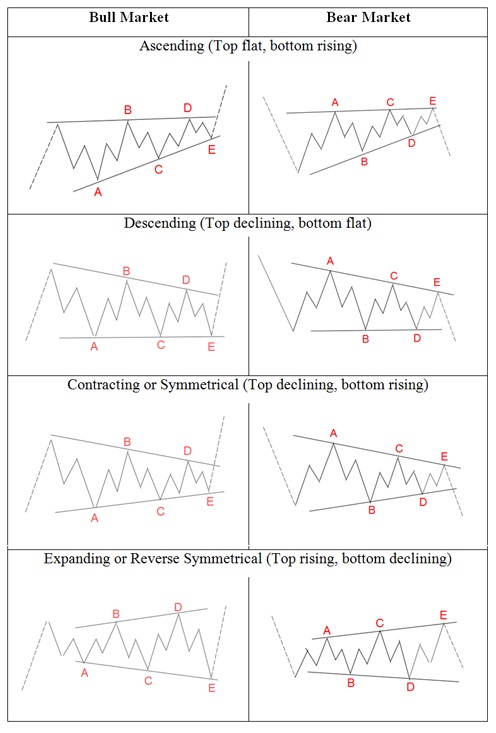
3.4 Diagonals (Contracting/Expanding Wedges)
3.4.1 Still contain five subwaves but move in a wedge-like shape.
3.4.2 Internals may not always show five-wave subdivisions.
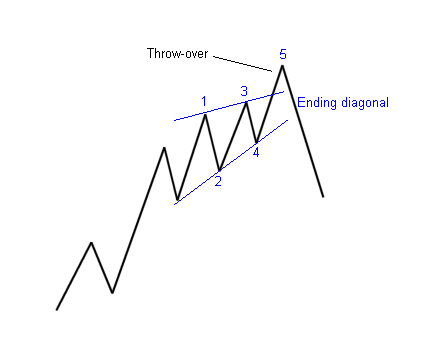
3.5 Ending Diagonal
3.5.1 Appears in Wave 5 of an impulse or Wave C of a correction.
3.5.2 Forms when a trend becomes exhausted (too far, too fast).
3.5.3 Indicates termination of a higher-degree trend.
3.5.4 Structure: 3-3-3-3-3 (each subwave has three parts).
3.5.5 Wave 2 and Wave 4 can overlap.
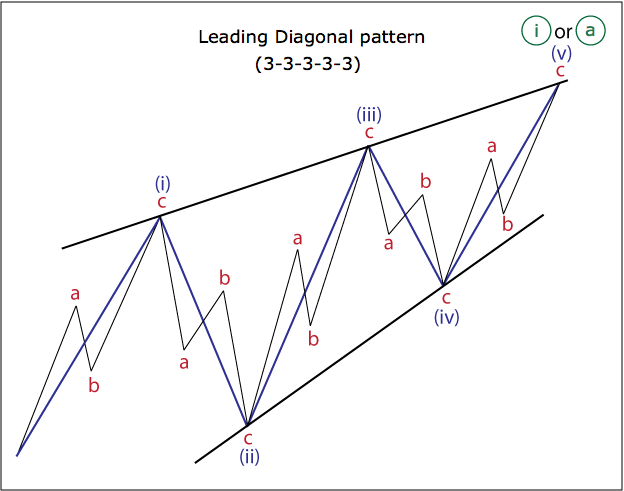
3.6 Leading Diagonal
3.6.1 Appears in Wave 1 of an impulse or Wave A of a zigzag.
3.6.2 Structure: 5-3-5-3-5.
3.6.3 Wave 2 and 4 overlap, forming a converging wedge.
3.6.4 Indicates beginning of a new trend, unlike ending diagonal.
Invalidation and Structural Failure
In CWCOUNT’s Elliott Wave framework, every wave count is defined with a clear invalidation condition. A structure remains valid until a specific Elliott Wave rule is violated. Once invalidated, the scenario is removed — not revised or reinterpreted. Invalidation is not a loss of confidence. It is a structural failure that requires a new count.
To understand why Elliott Wave analysis should not be framed as prediction,
see: Elliott Wave Is Not Prediction — A Rule-Based Market Structure Framework.
For a real-world example where a predefined invalidation level
structurally ended a preferred wave count,
see: Elliott Wave Invalidation — A Real-World Example.
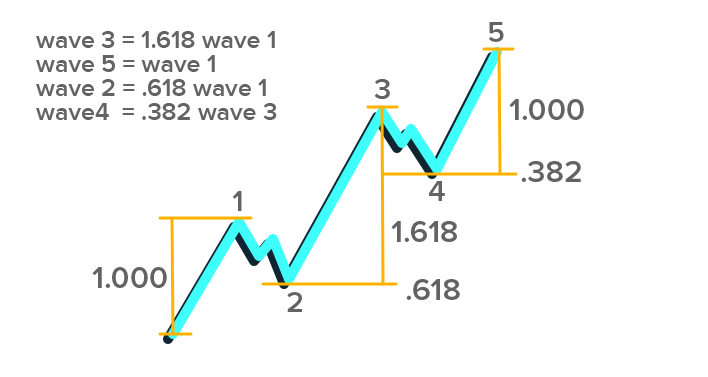 5.3 Fibonacci Extensions
The Complete Wave Template
If you look at the macro level trends or at the micro level trends (above), the individual components of a set of waves, you see the same basic pattern repeating again and again, so you can say that market structure is fractal in its character. The micro level waves are simply more granular and detailed models exhibiting all the characteristics of the macro level waves.

The Cycle Degree
The cycle degree has different names to identify the position of the wave within the overall progress of the market. Based on the amplitude, the above illustration indicates the types of wave cycles from largest to smallest. These describe the degree of change in a larger cycle, or the amplitude. The cycle waves are subdivided into primary waves, that are in turn subdivided into intermediate waves which are in turn subdivided into minor and sub minor waves, with the smaller wave patterns having the same fractal characteristics.
CWCOUNT Color-Depth System
-
Core Rule (Most Important)
CWCOUNT colors represent wave depth (containment), not rank or importance.
An outer color shows a larger wave; inner colors show smaller waves nested inside it.
CWCOUNT uses color to represent wave depth, not degree names or importance.
The containment order is fixed as follows:
Blue → Purple → Red → Gold → Orange → Pink → Green → Burgundy → Gray.
A color to the left always represents a larger wave that contains the colors to its right.
This rule is consistent across all timeframes.
-
Why multiple colors appear on one chart
Markets are fractal. A single wave always contains smaller waves inside it.
CWCOUNT intentionally displays these nested structures instead of hiding them. -
How to read any CWCOUNT chart
Start with the outermost color to understand the big picture,
then move inward to read execution, structure, and timing. -
Timeframe-relative meaning
The same color can represent different sizes on different timeframes.
Wave size is relative, but the containment relationship is always consistent. -
One-sentence summary (recommended to display prominently)
“In CWCOUNT charts, colors describe how waves are nested inside each other.
The outer color defines context, and inner colors explain structure and detail.”